polars-telemetry
Telemetry for Polars queries: a span per query with its plan and per-node metrics for OpenTelemetry, or profiles you open in a browser-based viewer.
Unaffiliated with Polars and Polars Cloud
This package attaches to an interface polars exposes for its own cloud product. That interface is internal and carries no deprecation guarantee, so it can change or disappear in any polars release. See Compatibility for what happens when it does.
Note
This site tracks main, so it can describe work that is not released
yet. The changelog
says what shipped.
pip install 'polars-telemetry[otlp]'
import polars_telemetry

polars_telemetry.install()
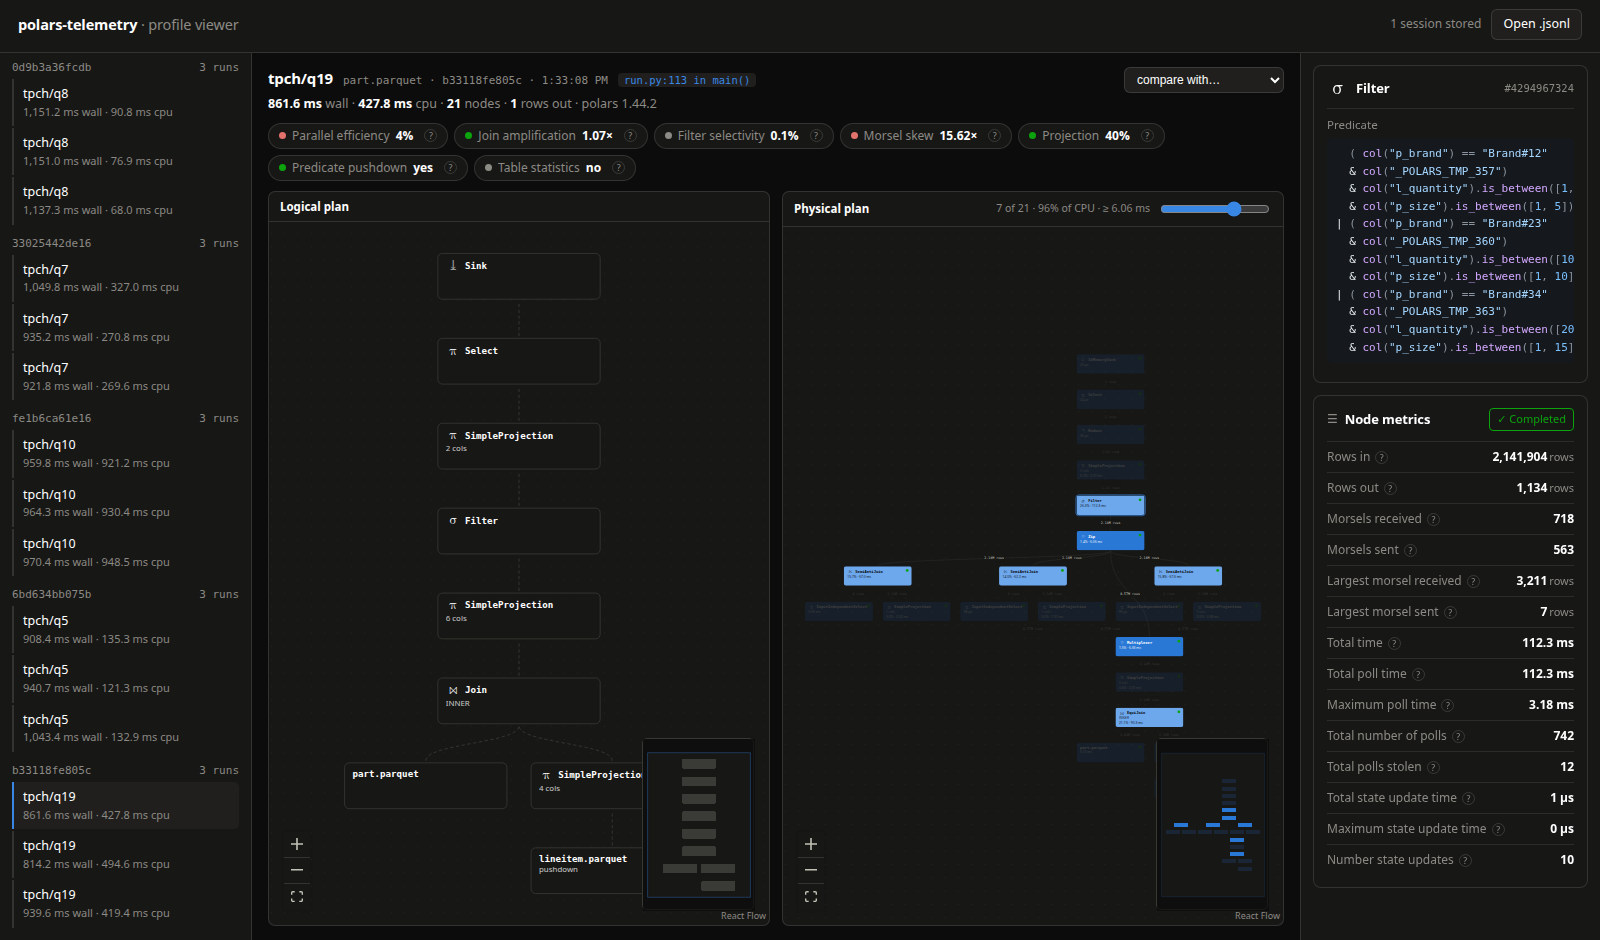
What you get
For every query polars runs:
- how long it took, how much CPU it used, and how well it spread across cores
- both plans: scans and their pushed-down filters, joins, group-by keys
- every node's counters: rows, morsels, polls, IO time and bytes
- the most expensive node, and diagnostics such as filter selectivity and join fan-out
- the file, line and function that ran it, and your own label
Where to start
| You want to… | Read |
|---|---|
| Try it in two minutes | Getting started |
| Choose where queries go | Exporters |
| See inside one slow query | JSONL and the viewer |
| Monitor queries in production | OpenTelemetry |
| Know what leaves your process | Data and privacy |
| Look up an attribute | Spans and metrics |