Profile viewer
The viewer reads the .jsonl files the JSONL exporter
and profile() write, and shows both plans of each query with every counter.
Open the viewer, then drag one or more .jsonl files onto
the page, or use Open .jsonl.
Nothing is uploaded. Files are read in your browser. The page makes no requests of its own, except to fetch an example from this site when you ask for one.
Try it
The empty viewer offers two example sessions, one click each: the 22 TPC-H
queries at scale factor 1 and 10, three runs each, labelled tpch/q1 to
tpch/q22. They are also in the repository's
examples/,
for a viewer opened from disk.
Sessions
Each file you open becomes a session, kept in your browser so it is still there
after a reload. The left sidebar lists sessions with when their queries ran;
the download button saves one as a .jsonl again, and × removes it.
Double-click a session's name, or press F2 on it, to rename it.
Where the browser keeps nothing, such as in a private window or with the page opened from disk, the viewer works for the current page only and says so.
Finding a query
The session overview lists each query shape, the runs of one query, with its total and mean times. Click a column header to sort by it.
Queries are titled by their label, or else by the first table they read. The search box matches labels, file names, tables and fingerprints.
The address bar follows what is on screen, so reload and the back button work as expected. A link only opens in the browser where that session was imported.
Reading a plan
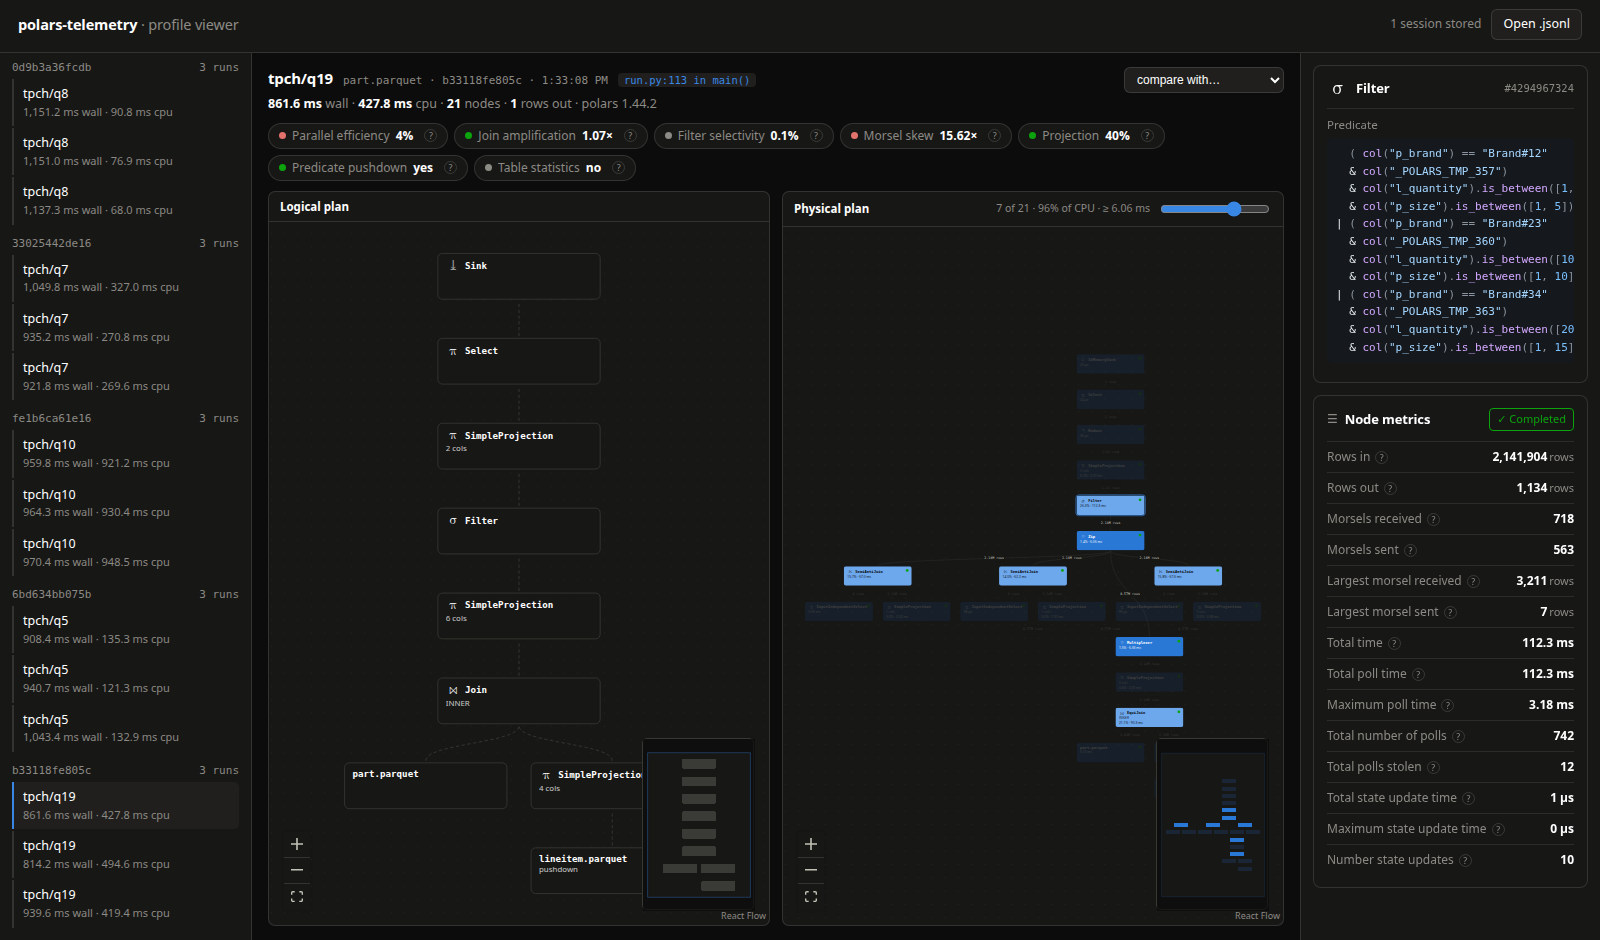
Each query shows the logical plan on the left and the physical plan on the right. Drag to pan, scroll to zoom; the minimap shows where you are.
- Logical plan: the plan as written, with your own column names.
- Physical plan: what ran. Nodes are shaded by their share of CPU time,
edges are labelled with rows, and a dot shows whether each node finished.
polars renames grouped columns to
_POLARS_TMP_Nhere.
Click a node for its properties and every counter in the right sidebar. Each
counter's ? explains what it measures. Long expressions are set one method
call or condition per line.
To see where the time goes in a large plan, drag the slider above the physical plan. Each step fades the cheapest nodes still lit, and the readout says how many remain and how much of the CPU time they account for. The setting carries over to the next query as that share, not as a node count.
Comparing runs
When a query ran more than once, pick another run under compare with… and every figure gains its change in percent.
Sharing a query
Copy link puts the query on screen, and the run it is compared with, into a
link. The profiles travel inside the link itself, after the #, which browsers
never send to a server: whoever opens it sees the same plans, and still nothing
is uploaded.
A link opens as a session named after its query, marked opened from a link, not stored. Keep stores it like a file you opened, under whatever name you gave it.
Anyone who has the link can read everything in those profiles, and chat tools and browser history keep it. For a profile that was not masked before export, the viewer asks before copying. A plan too large for a link, at over 30,000 characters, is better sent as a file: download the session and share that.